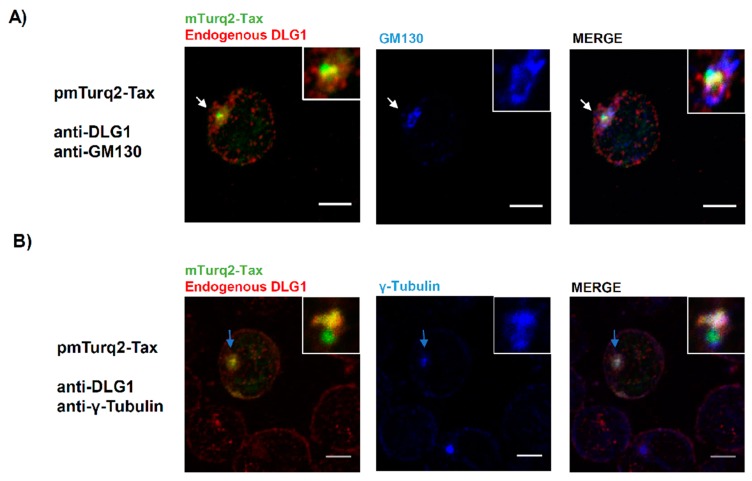
Figure 8.
Association of DLG1-Tax complexes with the Golgi/MTOC region in T-cells. Evaluation of co-localization of Tax-DLG1 complexes (yellow) with GM130 ((A), blue) and γ-tubulin ((B), blue) by confocal microscopy. Endogenous DLG1, GM130, and γ-tubulin were detected by IF using their respective specific antibodies. The white (A) and light blue (B) arrows indicate the region amplified in the inset, showing the protein co-localization. All scale bars represent 5 µm.

