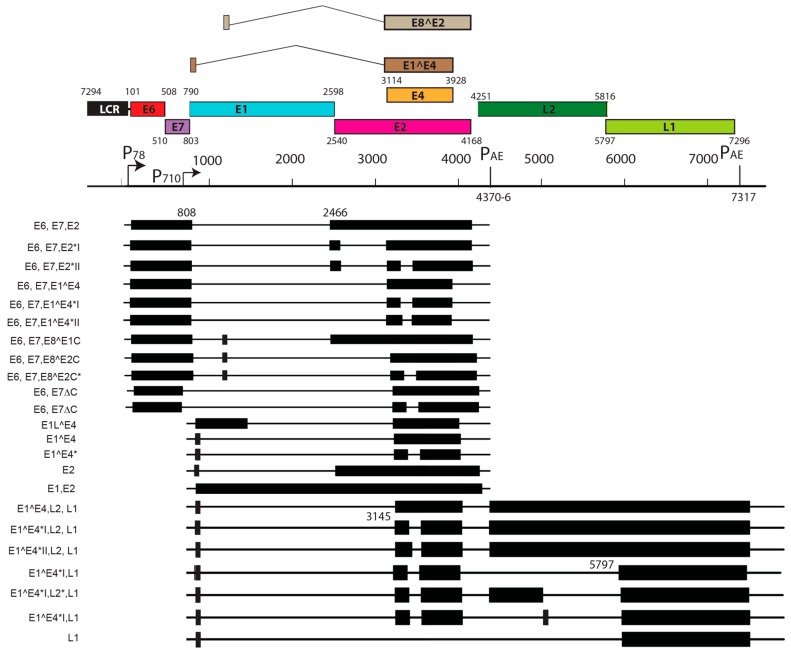
Figure 4.
Transcription map of MnPV1. This figure has been adapted and modified from [97]. The full transcription map for MnPV in productive lesions was assembled from PCR, RACE, and RNA-seq data. At the top, the genome organization of MnPV is presented for better understanding; numbers indicate the position of ORF starts and ends. Mapped TSSs 78 and 710 and pA cleavage sites 4370-6 and 7317 are depicted. For transcripts, exons are represented by black boxes (when coding for a particular ORF) while introns are marked as thin solid lines. Positions of the splice junctions in each transcript are given by numbers at the top.

