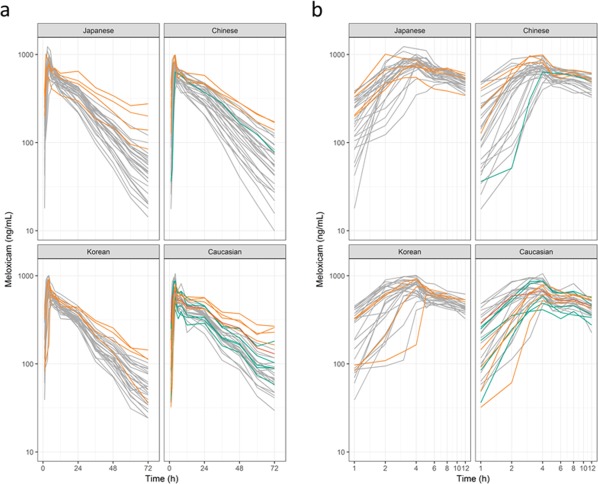
Figure 1.

Plasma concentration‐time profiles of meloxicam for (a) single and (b) double logarithmic plots. Individuals are represented by lines. Colors represent CYP2C9 genotypes; gray line, *1/*1; green line, *1/*2; orange line, *1/*3; and red line, *2/*2.
