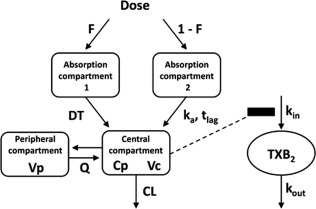
Figure 2.

Pharmacokinetic/pharmacodynamic model for meloxicam. Absorption phase profiles are described by zero‐order absorption and first‐order absorption with the lag time model. CL, apparent clearance; Cp, plasma meloxicam concentrations; DT, duration of meloxicam entry into the central compartment from the absorption compartment 1 by zero‐order rate; F, fraction of the dose absorbed through the zero‐order absorption process; ka and tlag, first‐order rate constant and lag time, respectively; kin, zero‐order rate constant for increases in percent serum thromboxane B2 (TXB2) generation relative to basal values; kout, first‐order rate constant for decreases in percent serum TXB2 generation; Q, apparent intercompartmental clearance; Vc, apparent volume of distribution in the central compartment; Vp, apparent volume of distribution in the peripheral compartment.
