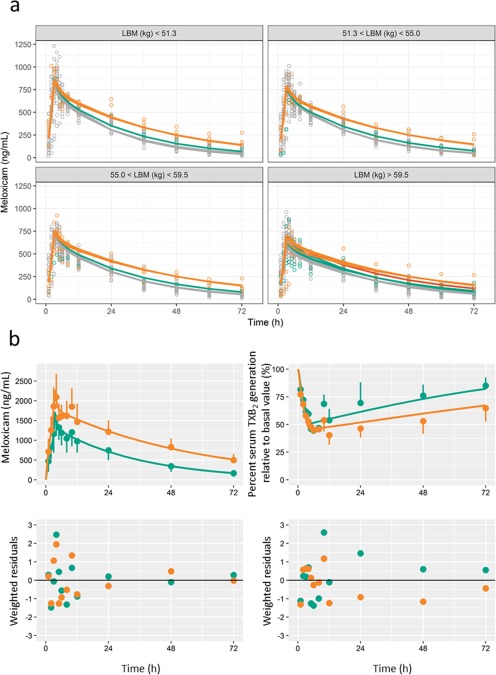
Figure 3.

Graphical fit of the population pharmacokinetic (PK) model and the PK/pharmacodynamic (PD) model. (a) Plasma concentration‐time profiles of meloxicam stratified by lean body mass; circles represent observed data from Hasunuma et al.6; lines represent population predictions; colors represent CYP2C9 genotypes; gray, *1/*1; green, *1/*2; orange, *1/*3; and red, *2/*2. (b) Plasma meloxicam concentration and percent serum thromboxane B2 (TXB2) generation relative to basal value‐time profiles; left upper panel, plasma concentration profile after administration of 15 mg of meloxicam; right upper panel, profiles for percent serum TXB2 generation relative to the basal value; left and right lower panel, PK and PD residuals plots. Plasma meloxicam concentration plots represent data from Bae et al.,14 and plots of percent serum TXB2 generation were calculated as the difference between 100% and the scanned percent inhibition of TXB2 generation. Circles represent observed average data. Lines represent predictions. Colors represent CYP2C9 genotypes; green, *1/*1; and orange, *1/*13. Error bars represent SDs. The SDs at 1–8 hours after administration were not digitized because the error bars were not recognized for all groups.
