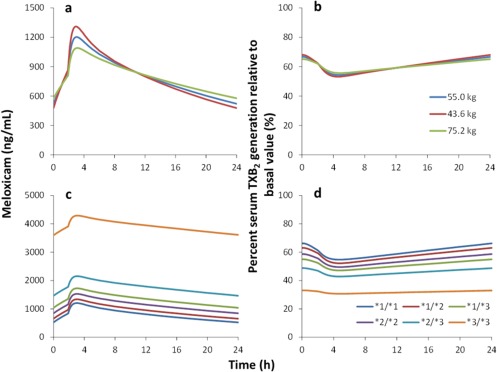
Figure 4.

Relationships between changes in covariates and the effects of meloxicam. The graphs show the impacts of lean body mass (a, b) and CYP2C9 genotypes (c, d) on plasma meloxicam concentrations and percent serum thromboxane B2 (TXB2) generation relative to basal value‐time profiles. The simulation was performed by varying CYP2C9 genotypes or lean body mass for 7.5‐mg daily meloxicam administration under steady‐state conditions. a and b, CYP2C9 *1/*1 genotype; c and d, the lean body mass is 55.0 kg.
