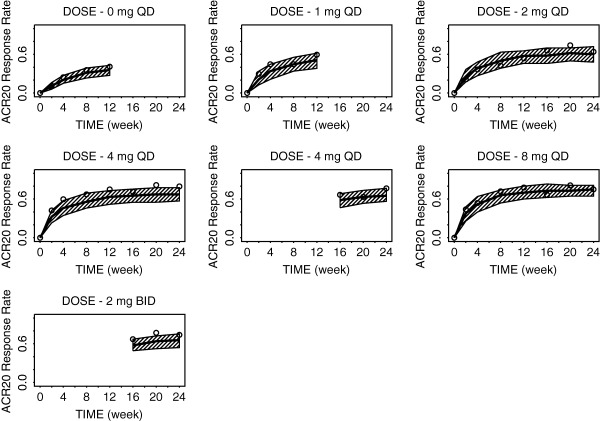
Figure 2.

Model‐predicted and observed time course of American College of Rheumatology (ACR)20 response rates for various doses of baricitinib through week 24. The solid line is model‐predicted median response rate, the shaded area represents the 90% prediction intervals, and the open circles represent observed sample proportions.
