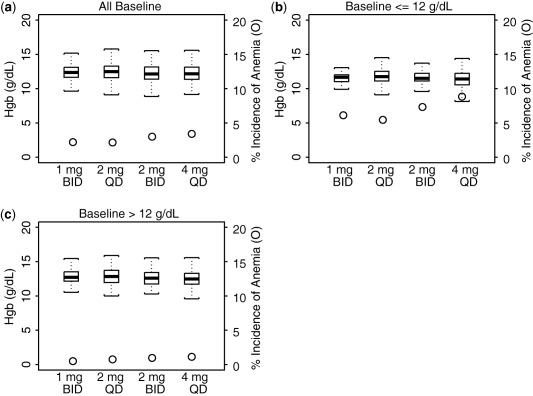
Figure 5.

Model‐predicted absolute value of hemoglobin at steady‐state of dosing and corresponding incidence of anemia for all baseline hemoglobin (Hgb) (a), for baseline Hgb ≤12 g/dL (b), and for baseline Hgb >12 g/dL (c), for 1 mg b.i.d., 2 mg q.d., 2 mg b.i.d., and 4 mg q.d. dosing regimen. The box plots represent the absolute values of Hgb and were constructed with median, 25th and 75th percentiles, and the minimum and maximum values and uses y‐axis on the left. Circles represent incidence of anemia and uses y‐axis on the right.
