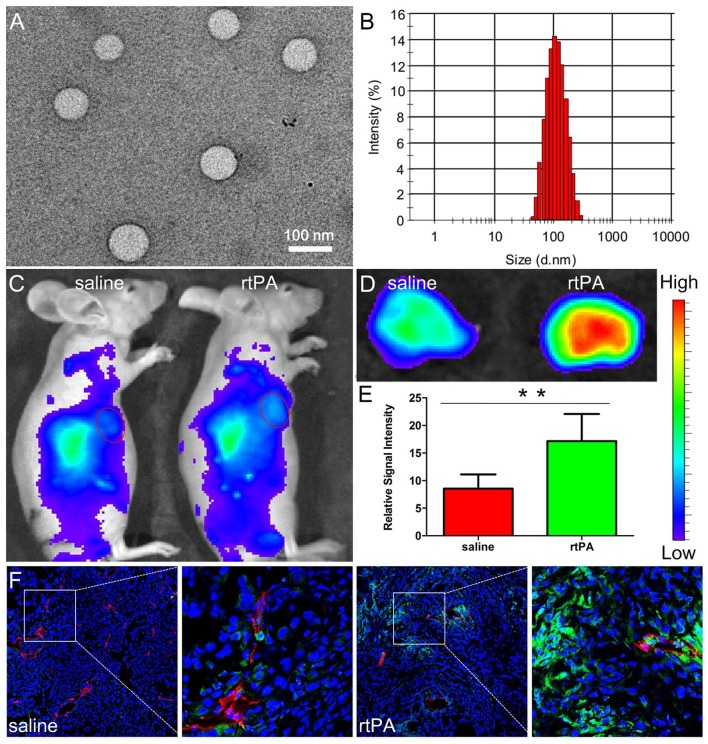
Figure 3.
Characterizations of NPs and effects of rtPA treatment on tumor nanoparticle delivery. TEM photograph (A) and size distribution (B) of NPs. Bar: 100 nm. In vivo (C) and ex vivo imaging (D,E) of A549 xenograft-bearing mice treated with 2 weeks of rtPA (25 mg/kg/d) or saline 24 h after the injection of DiR-labeled NPs. **p < 0.01 rtPA vs. saline group. In vivo distribution of NPs in tumor tissues. (F) Original magnification: 120 ×. Reprinted from reference with permission, Copyright Elsevier, 2016.

