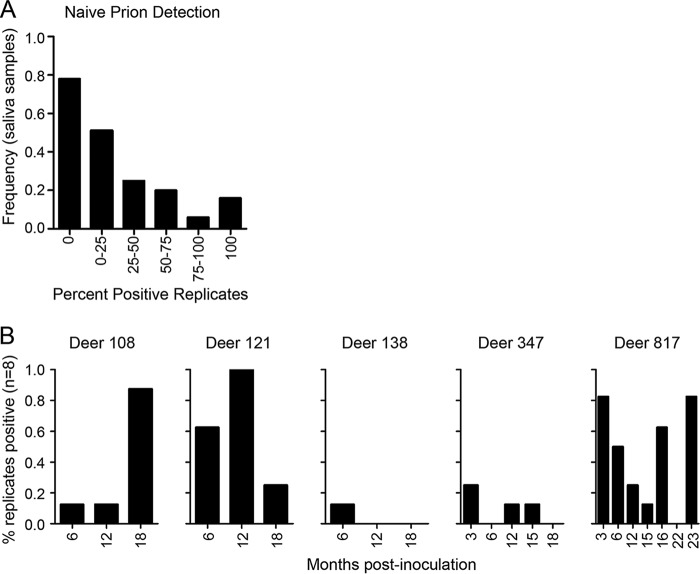
FIG 2.
Representative RT-QuIC data for saliva from CWD-infected deer over the course of observation. Each sample was tested in quadruplicates in two experiments (n = 8 replicates total). (A) The numbers of samples with 0%, 0 to ≤25%, 25% to ≤50%, 50 to ≤75%, 75 to <100%, or 100% positive replicates (raw, or naive, results) are indicated by the y axis. (B) The percentages of replicates that were positive for individual samples are indicated by bars. The x axis specifies the months postinoculation; a label on the x axis with no bar indicates that a sample was tested, and no replicates were positive. The observations of imperfect detection (A) and apparent randomness in shedding (B) in the raw data, as depicted here, motivated us to pursue a modeling approach that accounts for detection error.

