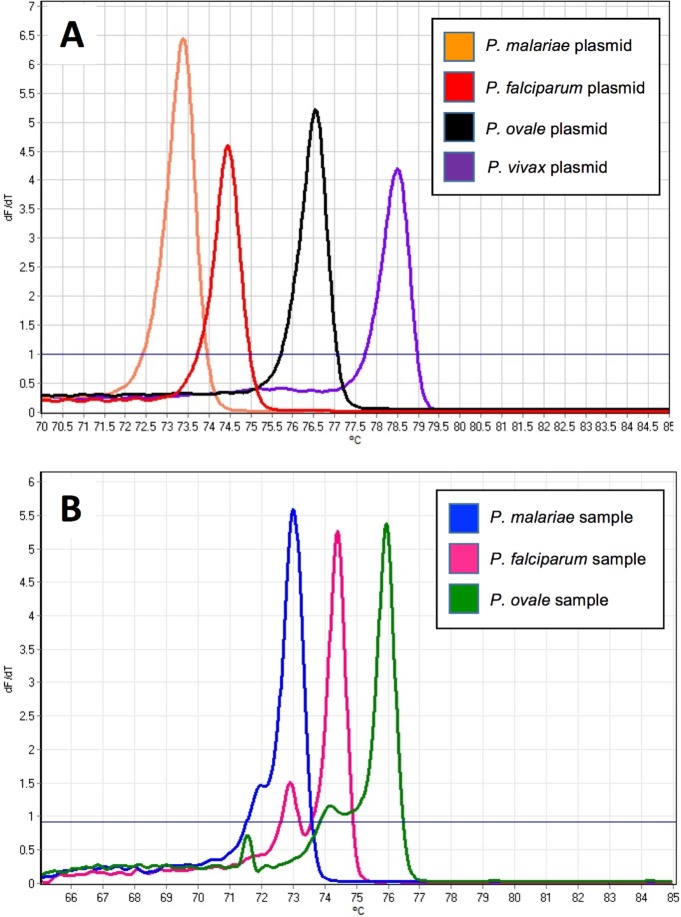
FIG 1.
Comparison of melting profiles for controls and patient samples. (A) Melt peaks of control plasmids used to determine malaria species. (B) Melting curves generated from nucleic acids derived from blood pellets. The data shown were generated by taking the negative of the first derivative of the raw melting data (y axis) derived from each control plasmid and plotting it against temperature (x axis). The fluorescence threshold (solid blue line) was used as a noise filter.

