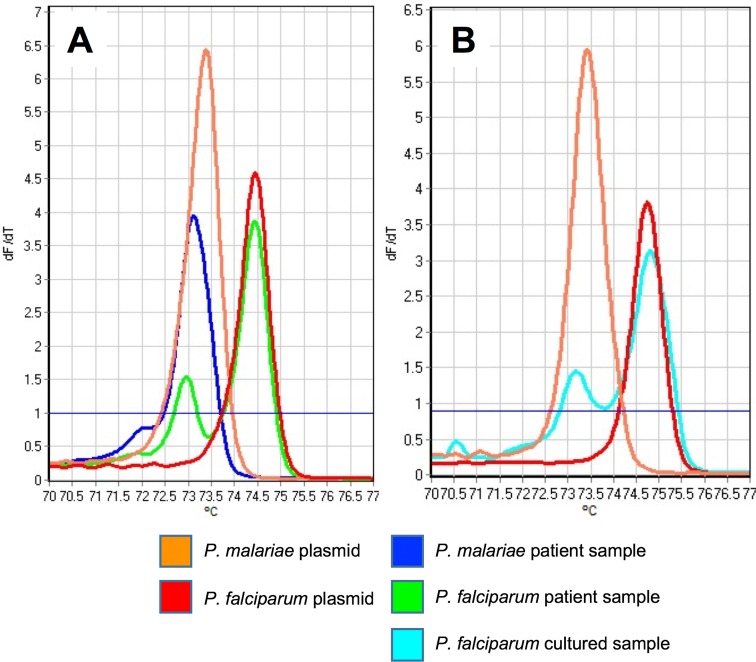
FIG 2.
Comparison of melting profiles for controls, patient samples, and cultured parasites. (A) Melting curves for P. malariae and P. falciparum control plasmids and patient samples. Note the double peak shown by the P. falciparum sample. (B) Melting curves for the same P. malariae and P. falciparum control plasmids, compared to the melting curve generated using a laboratory-cultured sample of P. falciparum. The double peak displayed by P. falciparum samples is therefore diagnostic of the species, rather than indicating double infections in patient samples.

