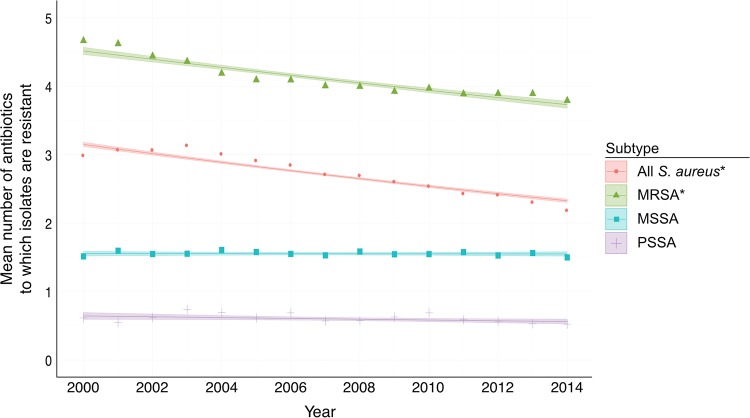
FIG 2.
Mean resistances of S. aureus isolates from 2000 to 2014. Estimates adjusted for age, sex, Charlson comorbidity index, type of clinical isolate (blood versus nonblood), and onset (community versus hospital). Lines represent model fits, shaded areas are 95% confidence intervals, and data points represent unadjusted mean resistances. Asterisks indicate trends are significant.

