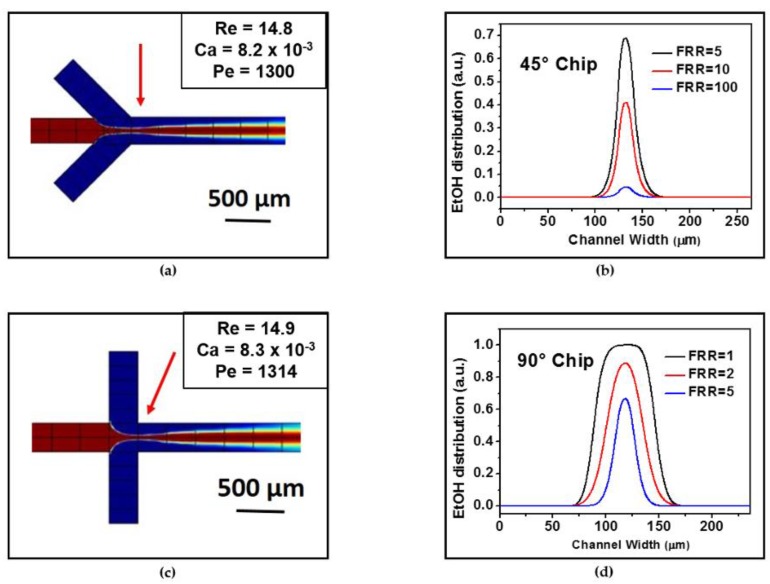
Figure 2.
The colour maps represent the distribution of ethanol (EtOH) in the hydrodynamic flow focusing region for (a) 45° chips and (c) 90° chips at a FRR = 5, and Qt of 30 µL/min and 150 µL/min. The red and blue colors refer to the EtOH and water domains, respectively. The maps reproduce the mixing of the two fluids occurring in the mixing channel. The red arrows indicate the mixing channel position where the ethanol distributions (shown in (b,d)) and the values of Re, Pe, and Ca (insets of Figure 2a,c) were calculated. The values of the peak areas estimated at three different FRRs are reported in Table 1.

