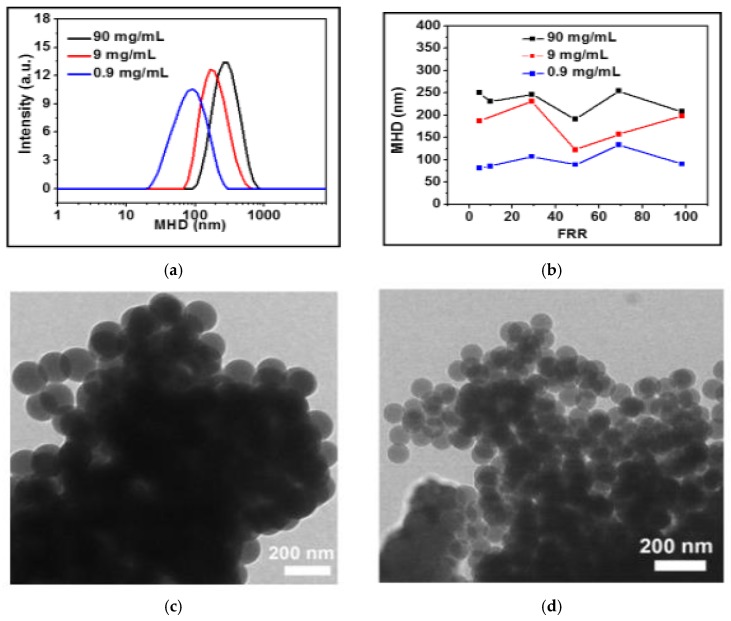
Figure 4.
(a) DLS spectra of liposome solutions produced inside 45° chips at FRR = 5, at three different lipids concentrations; (b) plot of the Z-average MHD versus the FRR at three different lipids concentrations inside 45° chips. Transmission electron microscopy (TEM) pictures of vesicles obtained through a 45° chip; (c) at FRR = 30 and lipids concentration of 90 mg/mL; and (d) at FRR = 70 and lipids concentration 0.9 mg/mL.

