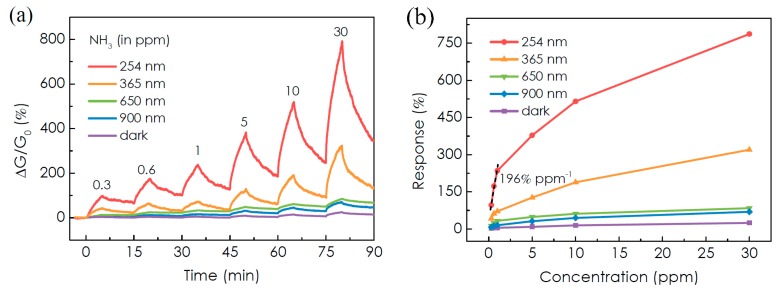
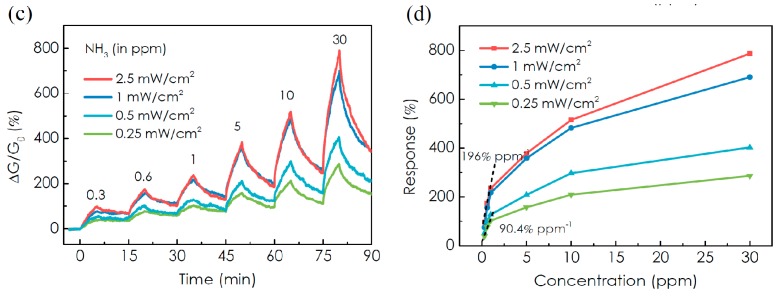
Figure 15.
(a) Real-time conductance change of the MoTe2 sensor upon exposure to different concentrations of NH3 in the dark and under light illumination; (b) calculated response and calibration curves of the MoTe2 sensor as a function of wavelength (photon energy); (c) real-time conductance change of the MoTe2 sensor upon exposure under 254 nm UV light illumination; and (d) calculated response and calibration curves of the MoTe2 sensor as a function of UV light intensity. Reprinted from [112], MDPI, Basel, Switzerland.


