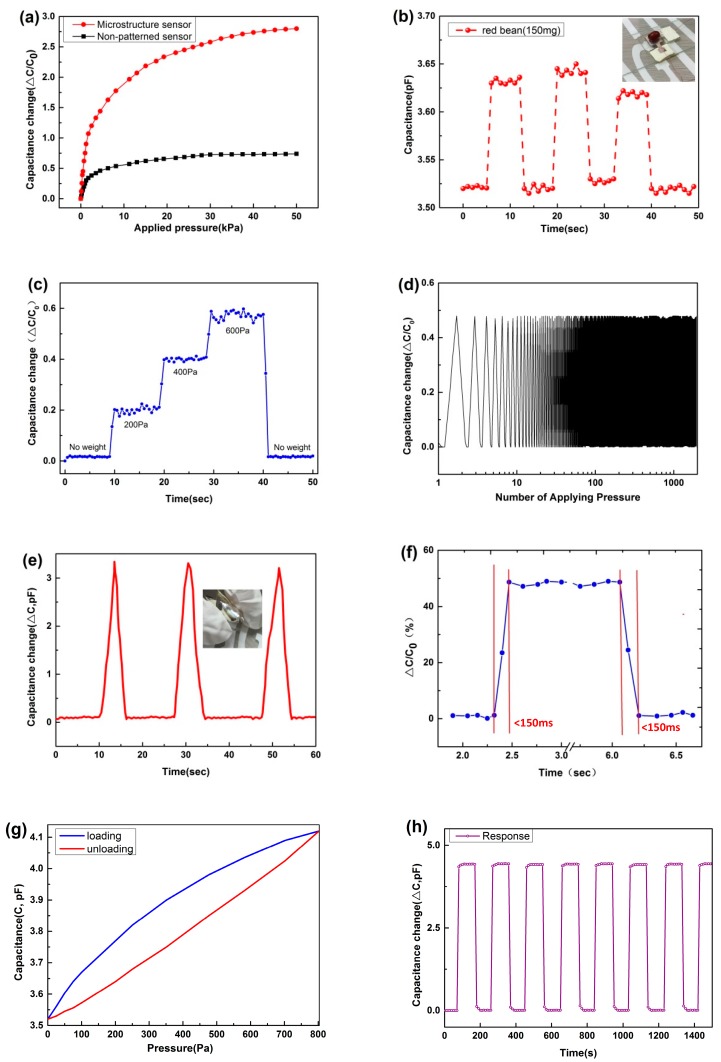
Figure 4.
Pressure response capabilities of the capacitive pressure sensor. (a) Relative capacitance change-pressure curve of the microstructure capacitance sensor (red) and non-structure sensor (black); (b) Capacitance–time curve with loading and unloading of a red bean (corresponding pressure of 19 Pa); (c) Real-time monitoring for applied pressure of 0.2, 0.4 and 0.6 kPa; (d) Stability test of the sensor wirh loading/unloading pressure over 1000 cycles; (e) Bending force (about 120°) was loaded onto the flexible pressure sensor; (f) Fast response and relaxation time (<150 ms) of the pressure sensor; (g) Hysteresis of output capacitance signal for an input pressure of ~800 Pa with 1 Hz force frequency; and, (h) Capacitance response curve of the microstructured sensor versus time over 10 pressing/releasing cycles with a pressure of 20 kPa.

