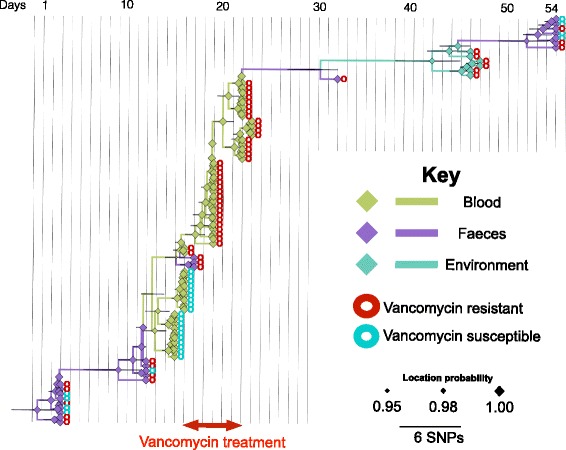
Fig. 2.

Bayesian phylogenetic tree for patient B/BAPS2 group. Branches and nodes are coloured based on the inferred origin of ancestral strains. The size of the diamond signs shows the posterior probability values for the inferred status. The bars on the nodes denote 95% confidence intervals, i.e. the credible set that contains 95% of the sampled values
