Fig. 3.

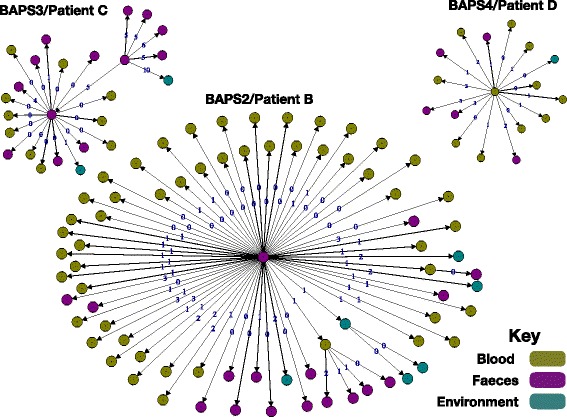
Transmission tree of BAPS2 isolates from three patients reconstructed based on genetic distance and isolate dates. The edge numbers denote the number of mutations. Arrows model potential transmissions from ancestors

Transmission tree of BAPS2 isolates from three patients reconstructed based on genetic distance and isolate dates. The edge numbers denote the number of mutations. Arrows model potential transmissions from ancestors