
Fig. 3.
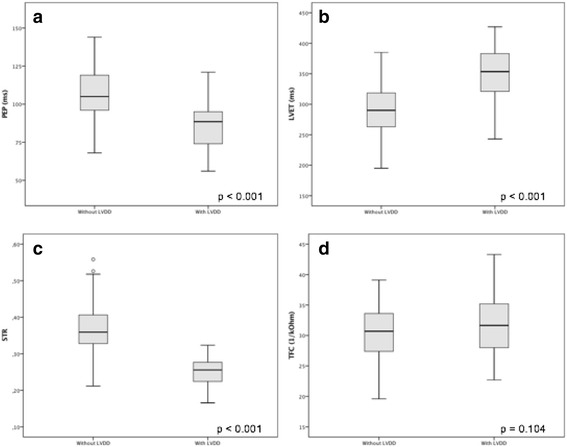
Distribution of the values of (a) pre-ejection period (PEP), b left ventricle ejection time (LVET), c systolic time ratio (STR) and d thoracic fluid content (TFC), as assessed by ICG, according with the diagnosis of LVDD (left ventricular diastolic dysfunction) by echocardiography. Graphics represent the interquartile range (P25-P75), median, limits and outliers. Comparison by Mann-Whitney test