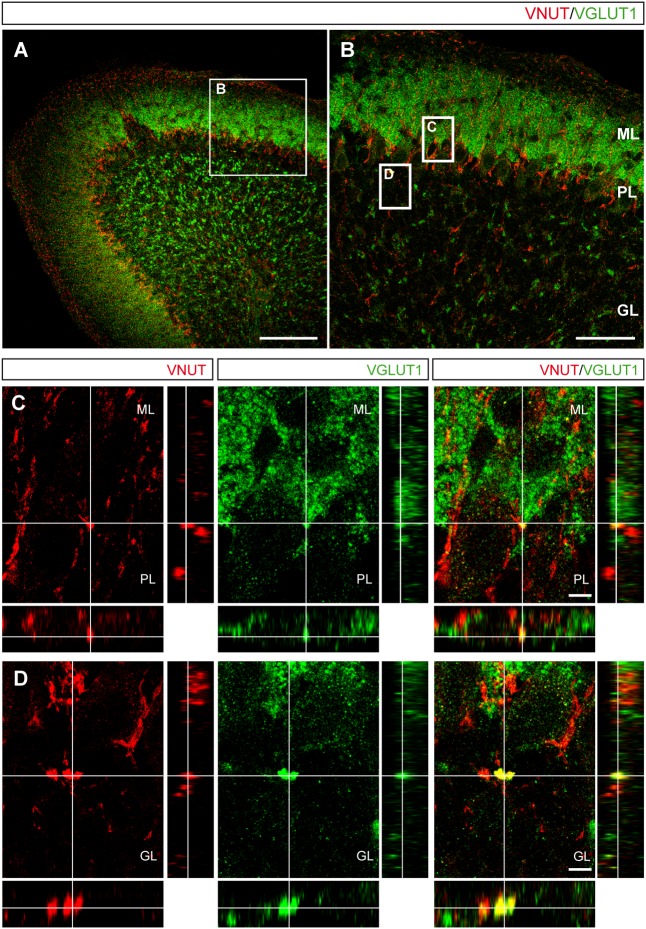
FIGURE 6.
Localization of VNUT and VGLUT1 in the mouse cerebellar cortex. (A) Representative micrograph of a section of the P15 cerebellum immunostained for VNUT (red) and VGLUT1 (green). Scale bar: 100 μm. (B) Higher magnification of the selected region in (A) showing the three cerebellar layers. Scale bar: 50 μm. The insets are shown in the lower panels. (C,D) Orthogonal sections. Selected z-scanning series of images showing double labeling for VNUT and VGLUT1, representing the three planes of view for one point, as indicated by the crossed dashed lines. Scale bar: 10 μm. ML, Molecular Layer; PL, Purkinje Layer; GL, Granular Layer.

