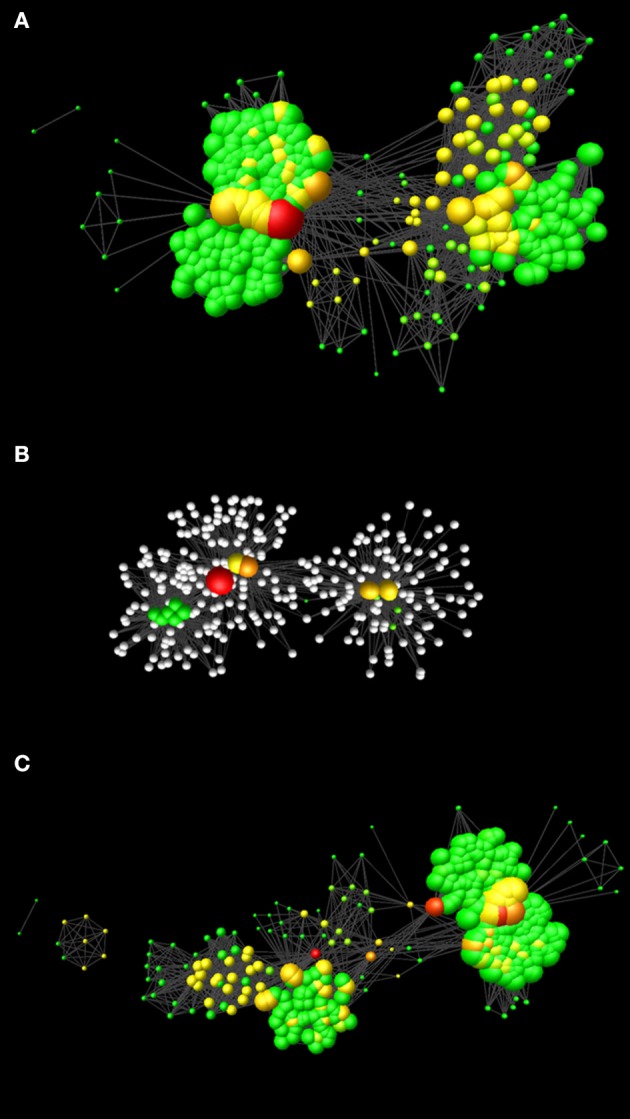
Figure 1.

Network models realized in this study. (A) Network representing the molecular events involved in cell cycle and cell cycle control (CCN). (B) Network representing the nodes affected by Aminopurvalanol A and those under their direct control. (C) Network resulting after the removal of the nodes affected by Aminopurvalanol A from CCN. In all the cases, the networks are represented with the Perfuse Force Directed Layout, and the node diameter is proportional to the node degree and the node color depends on the betweenness centrality (green = lower values, red = higher values).
