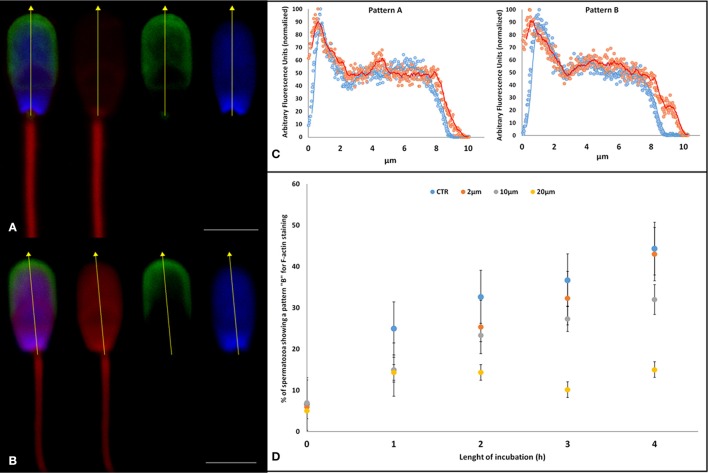
Figure 4.
Effect of Aminopurvalanol A on actin subcellular localization. (A,B) confocal scanning microscope images of a spermatozoon stained with DAPI (blue, nucleus), TRITC-conjugated falloidin (red, F-actin), and FITC-conjugated PSA (green, acrosome). With this staining technique we identified the acrosome-intact spermatozoa and we assessed the levels of fluorescence emitted by falloidin to astudy the effect of Aminopurvalanol A on actin polymerization using as a reference the nucleus. The fluorescence quantification was carried out along the longitudinal axis of sperm head (yellow dot line). In particular the spermatozoon in (A) display a Pattern A, that in (B) a pattern B. (C) The graphs display the graph resulting from the analysis of fluorescence emission pattern of spermatozoa showing a faint fluorescence emission over post-acrosomal region (Pattern A) and of spermatozoa, displaying high fluorescence emission over anterior area of sperm head (Pattern B). (D) Effect of incubation with Aminopurvalanol A, at different time, the percentage of spermatozoa showing Pattern B. The data are represented as mean ± satndard deviation, and the comparison were carried out by ANOVA two ways followed by Tukey's post-hoc test. See Table 2 for the results of statistical analysis.

