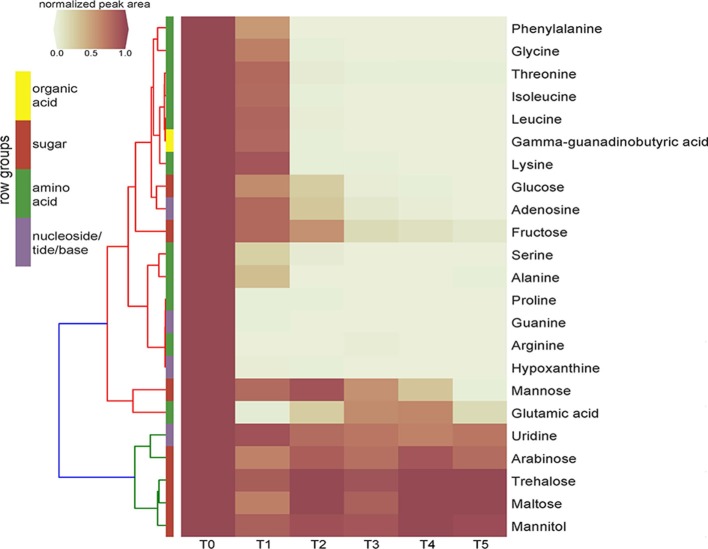
Figure 3.
Clustering heatmap of normalized peak areas for SDM1 metabolites across timecourse sampling of Pseudomonas sp. FW300-N2E2 spent media. Levels are displayed in terms of relative ratio to initial concentration at time zero (T0) with T0-5 representing 0, 3, 6, 9, 12, and 24 h time points, respectively. Metabolite row groups are colored according to the metabolite class they belong to.

