
Fig. 3. Modeled and observed delays in 40 urban areas.
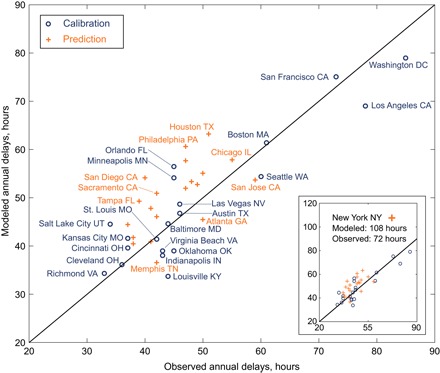
Pearson correlation coefficients and P values between observed and modeled delays are (0.91, 2.17 × 10⁻⁸) for the 20 cities used to calibrate the model and (0.63, 3.00 × 10⁻³) for the 20 cities used to validate the model. Observed delays were taken from the Texas A&M Transportation Institute Urban Mobility Scorecard (11).