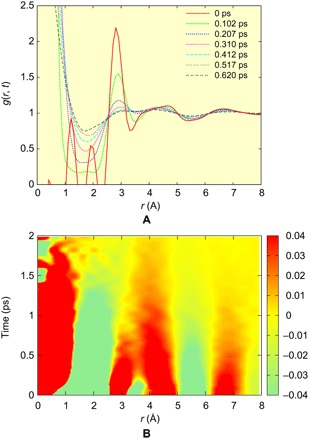
Fig. 2. The VHF of liquid water determined by IXS.

(A) g(r, t) at different times, and (B) 2D plot of g(r,t) – 1 for the IXS data. To show small changes in the second and third peaks, we used a narrow range (±0.04).

(A) g(r, t) at different times, and (B) 2D plot of g(r,t) – 1 for the IXS data. To show small changes in the second and third peaks, we used a narrow range (±0.04).