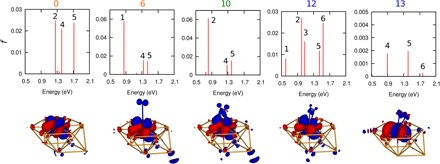
Fig. 3. Oscillator strengths and electron density differences.

(Top) Absorption spectrum (oscillator strength, f, versus excitation energy) for select structures along the dissociation trajectory (Fig. 1F), calculated from emb-SA-CASSCF transition dipole moments and emb-NEVPT2 excitation energies. Excited-state index given at the top of each red vertical line. Note that vertical scale changes across the panels. (Bottom) Real-space electron density difference plots between the fifth excited state and the ground state for s:0, s:6, s:10, s:12, and s:13 from emb-SA-CASSCF. Red is electron loss, blue is electron gain, and isosurface value is ±0.002 au; the Au10Mo-embedded cluster model + N2 are shown (see Fig. 1A for structural legend).
