
Fig. 2. Influence of reservoir- and fault-related parameters on the evolution of rupture arrest area.
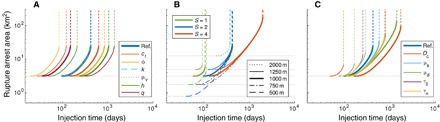
(A) Varying reservoir-related parameters, (B) varying strength parameter S and reservoir radius re, and (C) varying fault-related parameters. The reference solution (bold blue line) is the same in all three panels. In each panel, the same color depicts the solutions for the same varying parameter. For (A) and (C), thin and bold lines indicate solutions for lower and greater value of the corresponding parameter compared to that of the reference solution. For stresses in (C), the thin and thick lines indicate lower and higher values of S, respectively. Transition to runaway ruptures is marked by the dashed lines. The horizontal gray lines indicate the area of the intersection of the reservoir and the fault; it also corresponds to the minimal arrested area. The horizontal dotted gray line in (A) indicates constant maximum arrested area (in other panels, maximum arrested area varies). Note that in (C), the lines for τ0 and σ are almost identical.