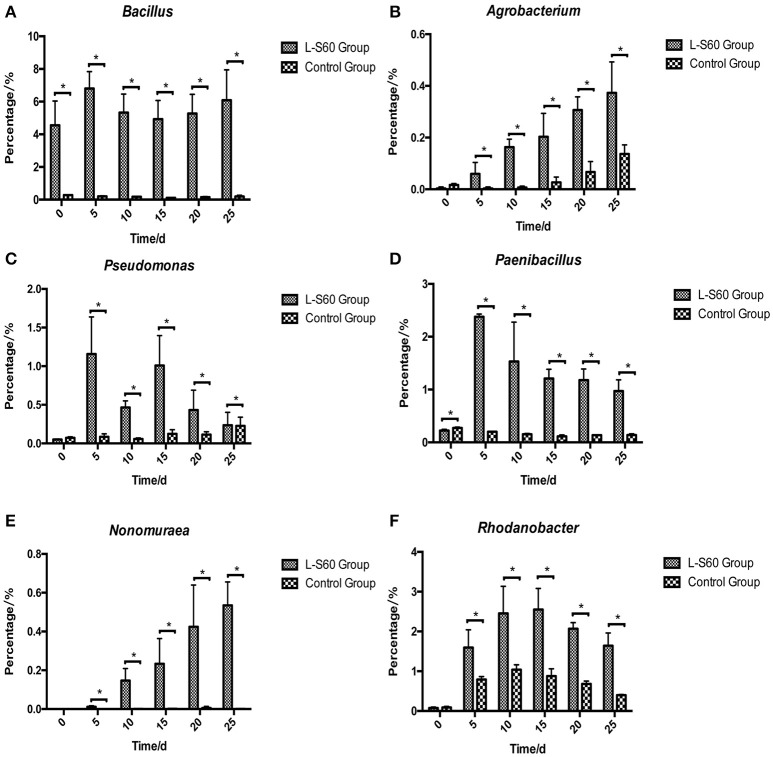
Figure 5.
Percentages of six beneficial genera were higher in L-S60 treatment group than in the control group. L-S60 Group represents seedlings treated by B. amyloliquefaciens L-S60; control group represents the seedlings without B. amyloliquefaciens L-S60 treatment. The x-axis represents collection dates of seedling substrate samples. Number “0” represents the substrate sample collected on the day of sowing, numbers “5–25” represents the seedling substrate samples collected on day 5, 10, 15, 20, and 25 after sprout. The y-axis represents (A) percentage of Bacillus, (B) percentage of Agrobacterium, (C) percentage of Pseudomonas, (D) percentage of Paenibacillus, (E) percentage of Nonomuraea, and (F) percentage of Rhodanobacter. Values are mean ± SD (n = 3), with significant differences by Student's t-test, “*” indicates significant difference (p < 0.05).

