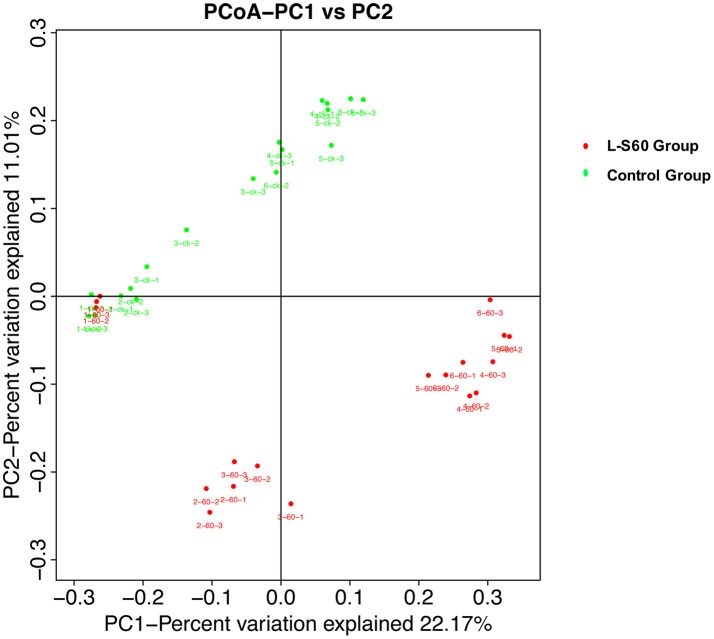
Figure 6.
Principal component analysis of the relative abundance of OTUs. L-S60 Group represents seedlings treated by B. amyloliquefaciens L-S60; control group represents the seedlings without B. amyloliquefaciens L-S60 treatment. The PC1 represents the maximum variation factor and PC2 represents the second principal coordinate. First numbers “1–6” mean different time points for sample collection; “one” represents the day of sowing, “2–6” means day 5, 10, 15, 20 and 25 after sprout. Number “60” means the samples from L-S60 treatment group; “ck” represents the samples from uninoculation control group. Second number “1–3” means three replicates at different time points. For example, the sample “1-60-1” means the first sample collected on the day of sowing from L-S60 treatment group, “1-60-2” means the second sample collected on the day of sowing from L-S60 treatment group. Names of other samples follow the same manner.

