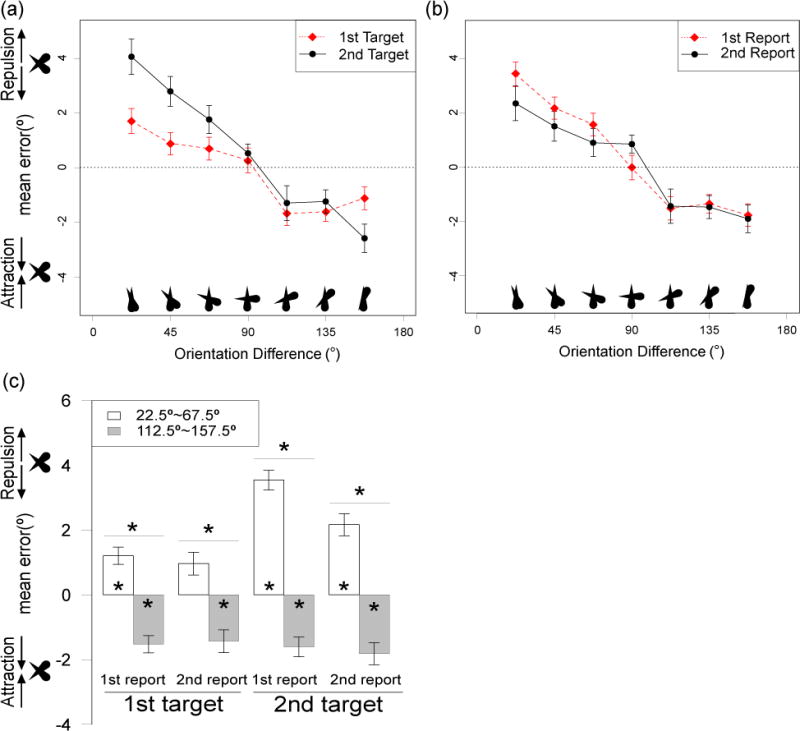
Figure 2.

(a, b) Mean response error as a function of the orientation difference between the two items in Experiment 1. Data in a are plotted separately for the first and second targets on each trial, collapsed across order of report. Data in (b) are plotted separately for the first- and second-reported item on each trial, collapsed across the initial order of presentation. Dependent variable is the angular distance between reported orientation and actual orientation of the target being reported, reflected according to the direction of the other target. Positive error indicates bias away from the other target, and negative error represents bias toward the other target; the zero line indicates no bias. (c) Mean response error, collapsed into groups of trials with relatively small orientation differences (<90°) and groups of trials with relatively large orientation differences (>90°). Reported orientation of a given target was biased away from the orientation of the other target when the orientation difference was <90°, but biased toward the other item when the difference was >90°. This effect was larger for the second than for the first target, but was comparable for the first and second responses. Error bars show the within-subjects standard error of the mean (Morey, 2008). Asterisks over a pair of bars indicate significant difference between the means. Asterisks inside the bar indicate that the mean is significantly different from zero. *p < .05, FDR corrected
