
Figure 3.
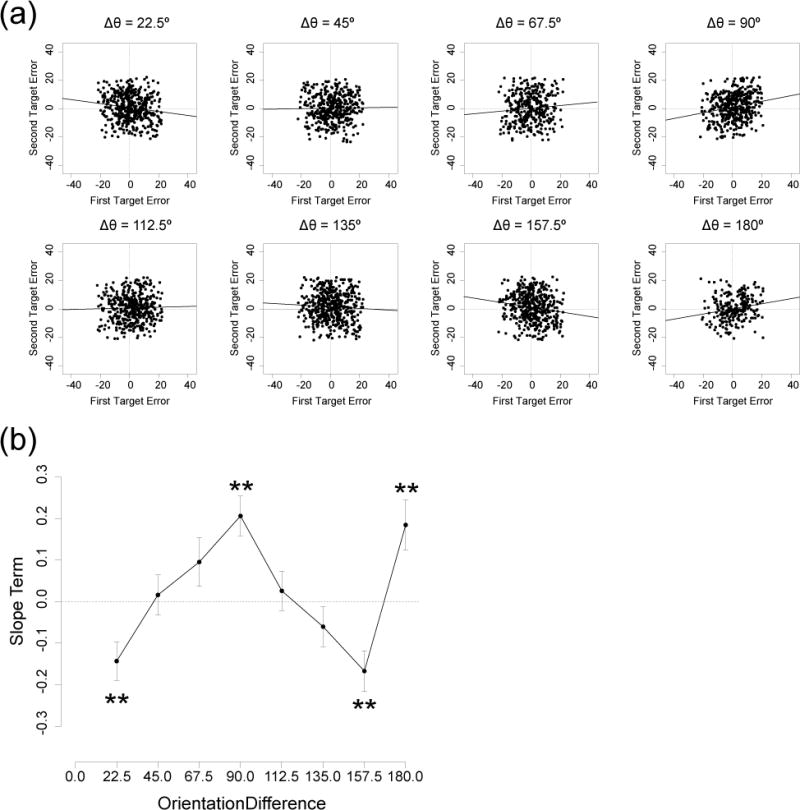
Trial-by-trial dependency between the two orientation reports in Experiment 1. (a) Scatterplots of response errors for the first (x-axis) and second (y-axis) targets on a given trial, with separate points for every trial in each observer, separated into the eight orientation differences. Trials with response errors larger than 22.5° were excluded to avoid contamination from random guesses and swapping errors. Solid line indicates maximum likelihood slope estimate from a linear mixed-effects model. (b) Slope term of the mixed-effects linear model obtained at each orientation difference. Error bars show standard error of each slope estimate. Asterisks indicate slopes that were significantly different from zero. **p < .01