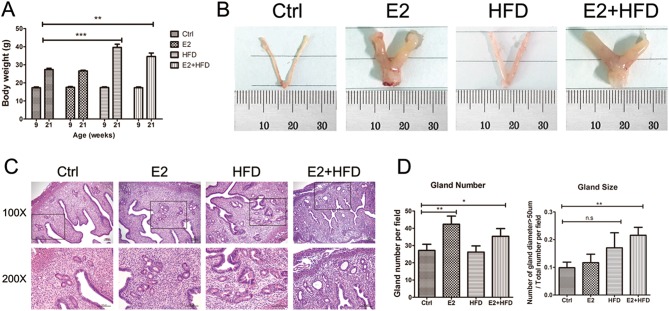
Figure 1.
Uterine size and histological performance. (A) Body weight change at the beginning (9 weeks) and end (21 weeks) of treatment (n = 8/group). (B) Representative morphological images of uteri from mice with estrogen and/or high-fat diet treatment. Ctrl, Control; E2, Estrogen; HFD, High-fat Diet. Ruler units, 1 mm. (C) Hematoxylin-eosin (H&E) staining of endometrium from mice with estrogen and/or high-fat diet treatment. The boxed areas in the top panel (100×) are magnified in the bottom panel (200×). Scale bars, 100 μm. (D) Gland number and size evaluation. The left panel represents the change of gland number per field, and the right panel represents the percentage of gland (diameter > 50 µm) in total glands per field. *P < 0.05, **P < 0.01, ***P < 0.001, n.s, no significant.

 This work is licensed under a