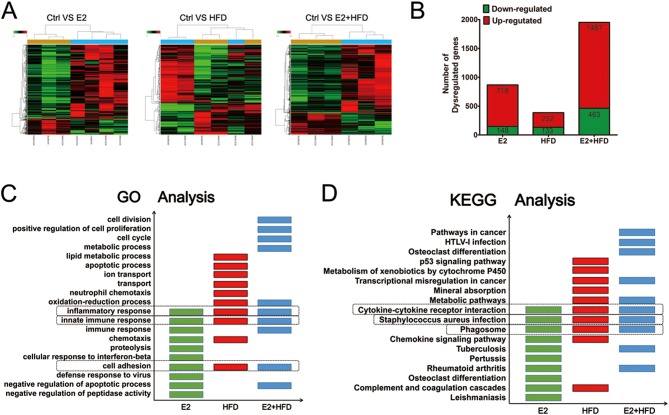
Figure 2.
Changes of mRNA profiles in mice treated with estrogen and/or high-fat diet. (A) Cluster analysis of dysregulated gene expression in the endometrium of mice. Samples in the heat map are labeled: GCS (100454, 100455, 98700) for Ctrl, GCS (100456–100458, 98701) for E2, GCS (100459, 100460, 98702) for HFD and GCS (98703–98705) for E2 + HFD. Red color represents highly expressed genes and green color represents lowly expressed genes. (B) The number of altered genes regulated by E2, HFD and E2 + HFD. The number of genes upregulated or downregulated (with >1.5- or <0.67- fold change compared to Ctrl group) are represented as red and green numbers, respectively. (C) GO analysis of E2, HFD and E2 + HFD regulated genes in mouse endometrial samples. The top ten functions are presented and overlapped functions are boxed. (D) KEGG analysis of E2, HFD and E2 + HFD regulated genes in mouse endometrial samples. The top ten pathways are presented and overlapped pathways are boxed.

 This work is licensed under a