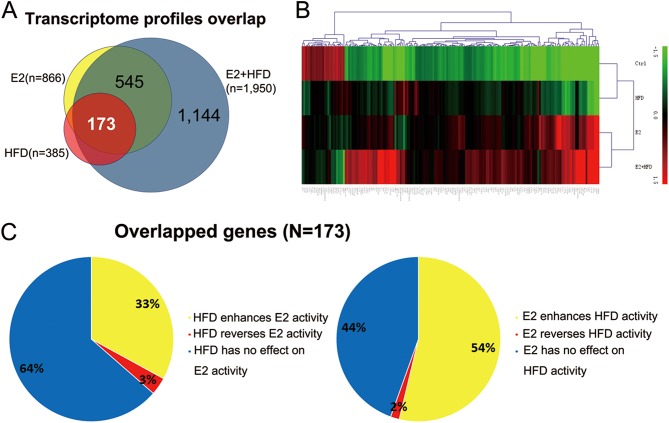
Figure 3.
Estrogen and high-fat diet synergically promote endometrial lesions. (A) The 173 commonly upregulated and downregulated genes of mouse endometrial microarray in E2, HFD and E2 + HFD groups compared to Ctrl group. (B) Heat map illustrating the expression patterns of the 173 commonly dysregulated genes in E2 and/or HFD. The red and green colors indicate high and low expression level of genes, respectively. (C) E2 and HFD control gene modulation reciprocally. The left pie chart is the effect of HFD on common differentially expressed genes in mouse endometrium. The right pie chart is the effect of E2 on common differential genes in mice endometrium. We regarded the fold change >1.5 as ‘enhanced’ and <0.67 as ‘repressed’.

 This work is licensed under a