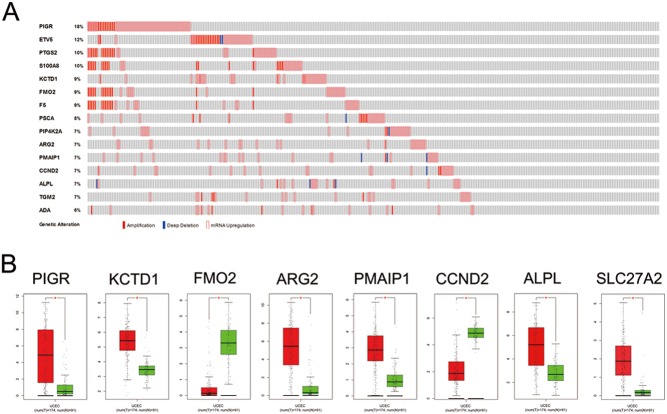
Figure 4.
Aberrantly expressed genes analysis based on TCGA data. (A) Genetic alterations. Red represents amplification, blue represents deep deletion and pink represents mRNA upregulation. Genetic alterations were found in 225 of 333 UCEC patients (68%). The aberrant expression threshold was defined as Z-score ± 2.0 from the TCGA RNA-Seq V2 data. (B) Comparisons of genes (PIGR, KCTD1, FMO2, ARG2, PMAIP1, CCND2, ALPL, SLC27A2) expression between UCEC cancer tissues and non-cancerous tissues involved in TCGA based on GEPIA. Y axis indicates the log2 (TPM + 1) for genes expression. Red bar shows the tumor tissues and green bar indicates the non-cancerous tissues. These figures were derived from Gene Expression Profiling Interactive Analysis (GEPIA). *P < 0.01. TPM, Transcripts per Kilobase Million.

 This work is licensed under a