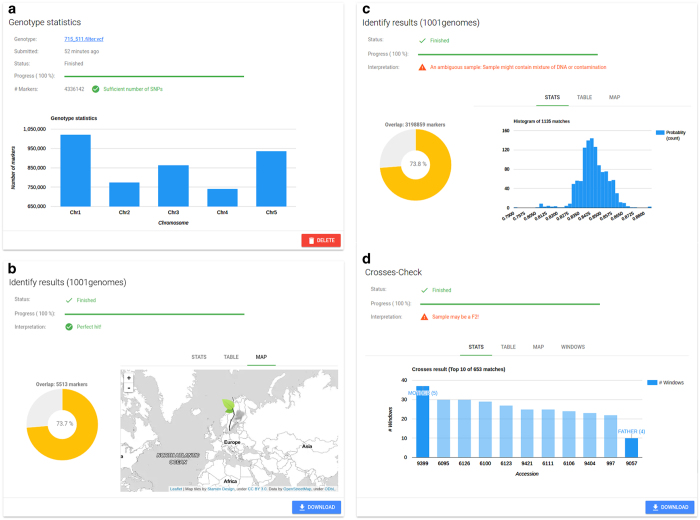
Figure 4. AraGeno web-application.
(a) General information about the uploaded genotype (VCF or BED) as well as the status of the parsing is displayed. (b,c) The results of the SNPmatch analysis are displayed in separate panels for two major SNP databases (‘1,001 Genomes’ and ‘RegMap’). A pie-chart highlights the overlap between the user-provided genotype and the SNP database. Depending on the analysis result, either a histogram or a column chart is displayed of the top matches. A table and map provide additional information about the highest matched strains. (d) If SNPmatch detects that the sample is possibly an individual of an F2 individual, an additional analysis starts automatically and, in case the cross is confirmed, information about the parents are displayed.

