Figure 5.
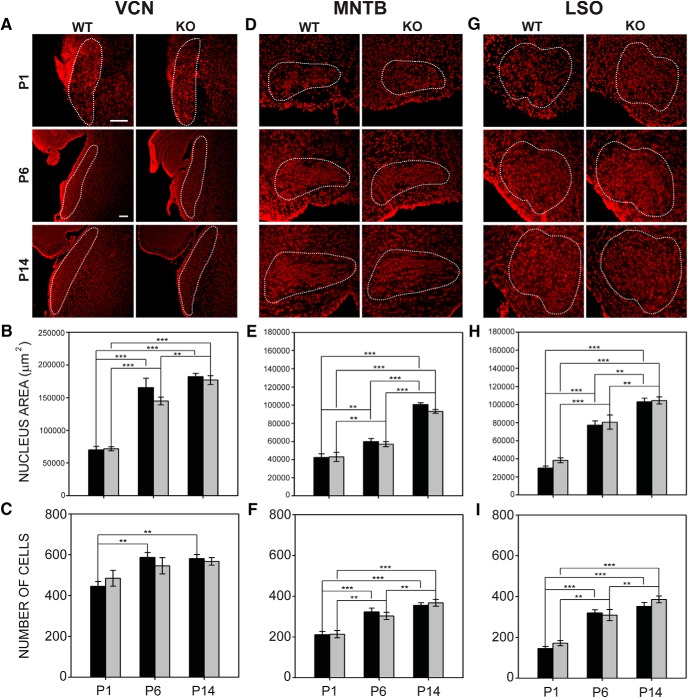
Nucleus growth and cell acquisition in wild-type and Fmr1 KO mice. A, Outlines of VCN in coronal sections at P1, P6, and P14. Medial is to the right. B, In VCN, both wild-type mice and Fmr1 KO mice show age-related increases in nucleus area. C, The number of cells in the wild-type VCN increased with age. Increases in cell number in Fmr1 KO mice did not reach significance. D, Outlines of MNTB in wild-type and Fmr1 KO mice at P1, P6, and P14. E, In MNTB, wild-type and Fmr1 KO mice both showed significant increases in nucleus size at all ages tested. F, Both wild-type mice and Fmr1 KO mice showed age-dependent increases in cell number in MNTB. G, Outlines of LSO in wild-type and Fmr1 KO mice at P1, P6, and P14. H, LSO grew in size at each age in both wild-type and Fmr1 KO mice. I, The number of cells in LSO in both wild-type mice and Fmr1 KO mice increased significantly with age. Top row in A: 100-μm scale bar applies to P1 images (20× magnification). Second row in A: 100-μm scale bar applies to for P6 and P14 images (10× magnification). *, p < 0.05; **, p < 0.01; and ***, p < 0.001.

