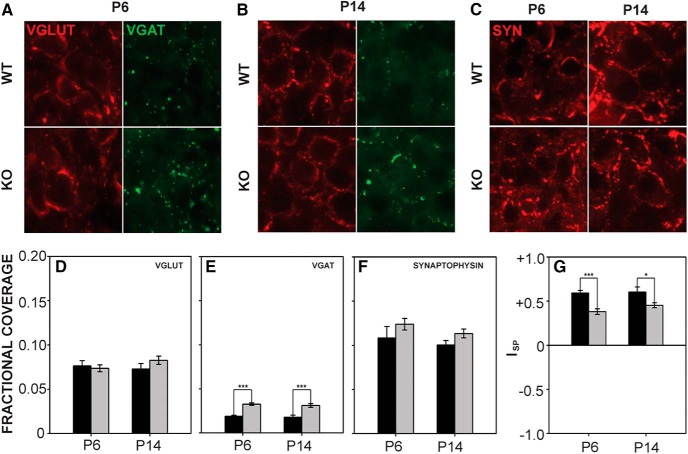
Figure 7.
VGLUT, VGAT, and synaptophysin expression in MNTB. A, B, VGLUT and VGAT expression in wild-type and Fmr1 KO MNTB at P6 (A) and P14 (B). C, Synaptophysin expression in MNTB in wild-type (top) and Fmr1 KO (bottom) mice. D, VGLUT fractional coverage did not vary between genotypes or ages. E, VGAT fractional coverage was significantly greater in Fmr1 KO MNTB at both P6 and P14. F, Synaptophysin coverage did not differ significantly by age or by genotype. G, ISP values were significantly smaller in Fmr1 KO mice at both P6 and P14. Scale bar in A = 50 μm; applies to A–C. *, p < 0.05; **, p < 0.01; and ***, p < 0.001.

