. 2017 Jul 28;125(7):076002. doi: 10.1289/EHP767

Figure 2.

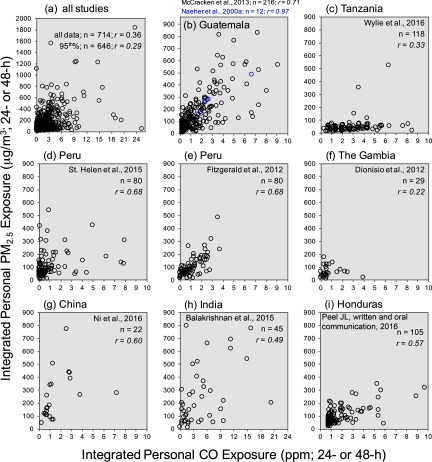
Scatter plot indicating integrated personal PM subscript 2.5 exposure in micrograms per cubic meter, 24- or 48-hours (y-axis) across integrated personal C O exposure in parts per million, 24- or 48-hours (x-axis), for nine groups, namely, all studies included, Guatemala, Tanzania, two studies from Peru, The Gambia, China, India, and Honduras.

Paired personal PM2.5 and personal CO exposure measurements for (a) all observations combined from nine studies and for (bi) individual studies. One outlying data point for Tanzania (CO: 25.2 ppm, PM2.5: 42.9μg/m3), one for Peru (CO: 25.2 ppm, PM2.5: 42.9μg/m3), two for Guatemala (CO: 18.5 ppm, PM2.5: 284μg/m3; CO: 23.6 ppm, PM2.5: 1,843μg/m3), and two for India (CO: 14.7 ppm, PM2.5: 1,226μg/m3; CO: 9.5 ppm, PM2.5: 1,243μg/m3) are not pictured to improve data visualization. 2h has an expanded CO concentration range along the horizontal axis.