
Fig. 4.
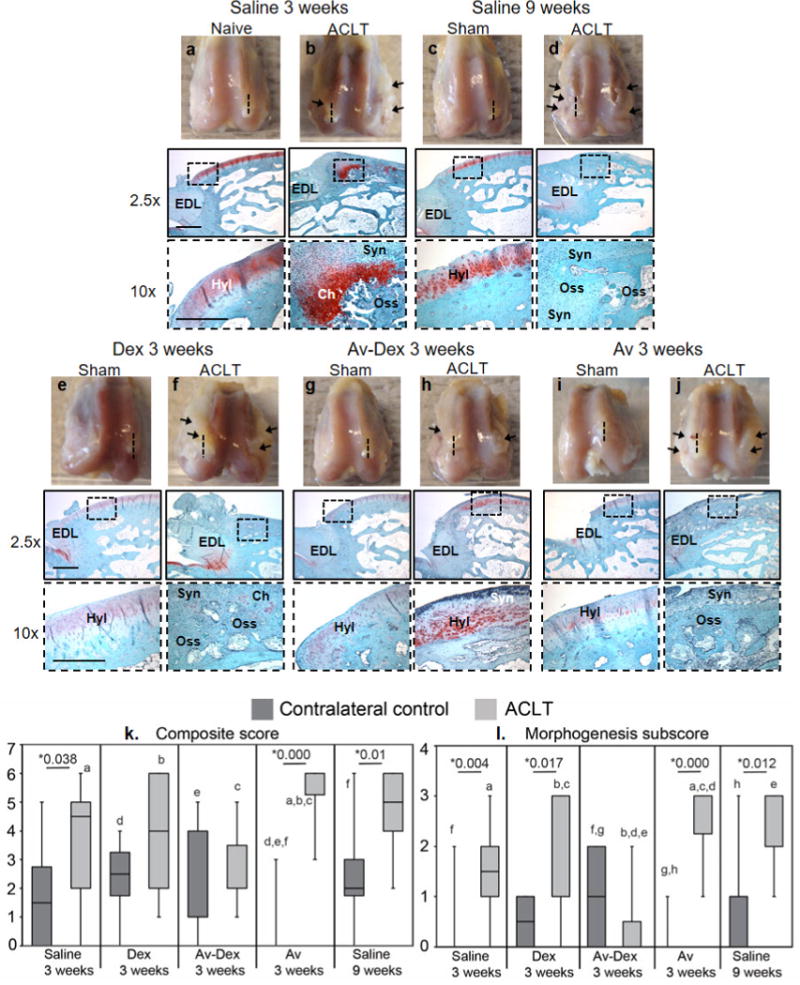
(a–j) Representative distal femora harvested 3 or 9 weeks after sham surgery or ACLT. Substantial bilateral synovitis and/or osteophyte formation (arrows) could be observed within ACLT knees. The lateral condyles were used for histology, bisecting them in a sagittal plane that cut through the enthesis (insertion site) of the extensor digitorum longus (EDL) tendon. The dotted lines indicate the approximate plane represented in the matched micrographs showing safranin O/fast green staining of the sagittal sections. Lower magnification images (scale bar = 1 mm) were acquired near the EDL enthesis, while higher magnification images (insets; scale bar = 200 μm) show the articular surface proximal to the enthesis. While hyaline cartilage (Hyl) could still be observed along the articular surface of control knees, in many ACLT knees, synoviocyte infiltration (Syn), chondrometaplasia (Ch) and endochondral ossification (Oss) were observed in this region. (k) Composite scores assessing synovial infiltration and morphogenesis at the peri-enthesis region shown in panels a-j are reported as box-and-whisker plots for the contralateral control (dark grey) and ACLT (light grey) knees of each treatment group (n = 7–10). Morphogenesis subscore is also shown. Median values with 25th–75th quartile range are reported. * shows significant difference between ACLT and control within each treatment group using Mann Whitney U test. Groups that share letters within each graph are significantly different from one another (p < 0.05, Kruskal-Wallis ANOVA followed by post hoc Dunn’s test).