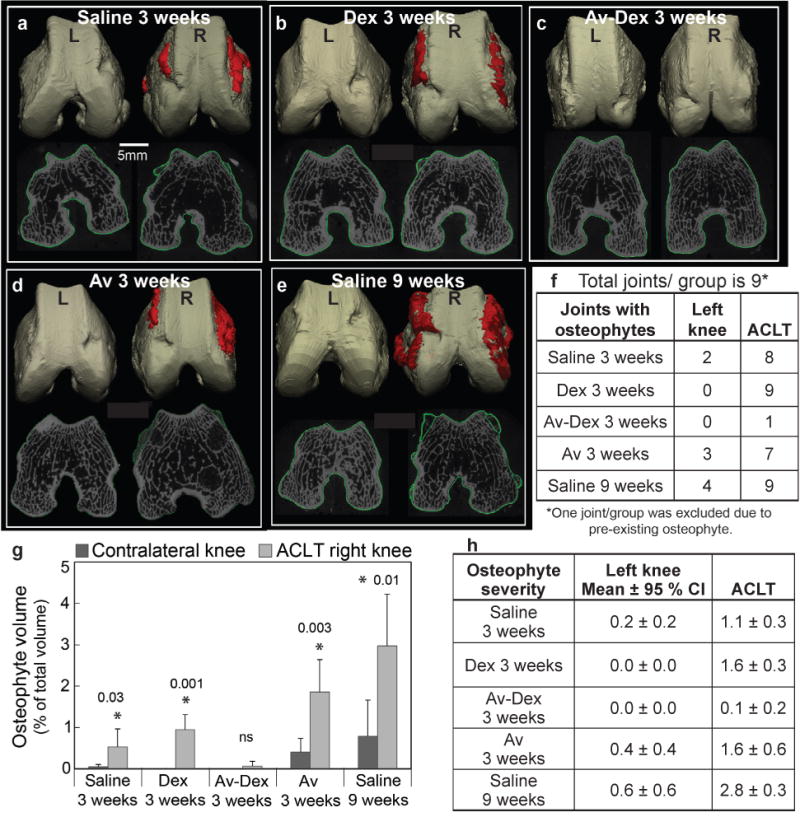
Fig. 5.

3D reconstructions of rabbit femoral condyles to show osteophytic bone growth for quantitative volumetric assessment in the following treatment groups: (a) saline 3 weeks, (b) Dex 3 weeks, (c) Av-Dex 3 weeks, (d) Av 3 weeks and (e) saline 9 weeks. Condyles on the left side of each image were from contralateral left knees (L) and those on the right side were from the experimental ACLT knees (R). Representative images are shown. (f) Number of joints out of nine in each treatment group that showed osteophyte formation. (g) Osteophyte volume expressed as percentage of total volume. Data are shown as mean ± 95 % CI. * shows significant difference (p < 0.05) between ACLT and contralateral knee within each treatment group. NS = not significant. (h) Osteophyte severity score where 0 = no observed osteophyte, 1 = local and less severe osteophytes, 2 = widespread but moderately severe osteophytes and 3 = widespread and very severe osteophytes.
