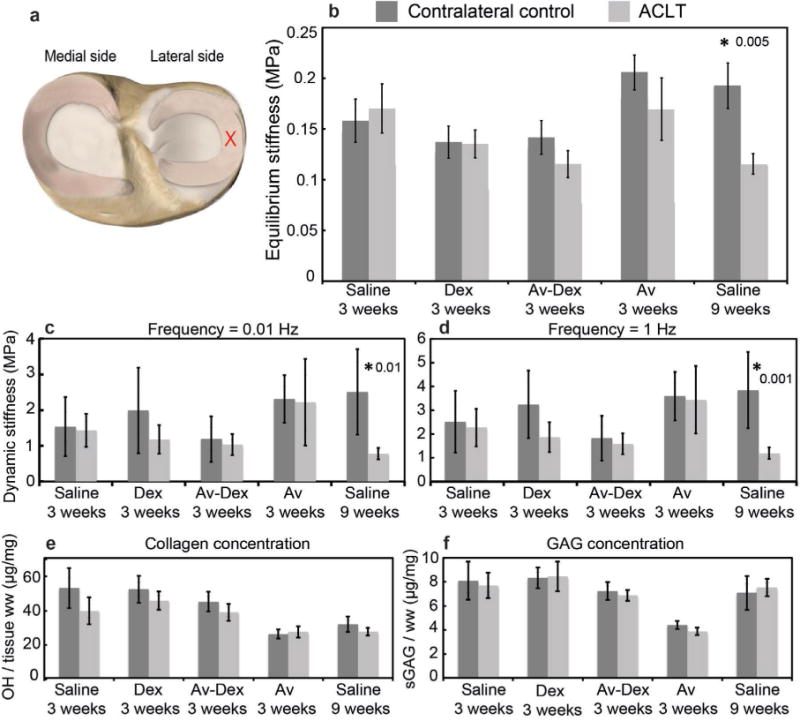
Fig. 8.

Mechanical and biochemical properties of lateral meniscus. (a) Red cross represents the location tested on the lateral meniscus. (b) Average equilibrium stiffness values of lateral meniscus for each treatment group. Average dynamic stiffness measured in lateral meniscus at (c) 0.01 Hz and (d) 1 Hz. (e) Collagen concentration and (f) GAG concentration measured in lateral meniscus. Data are shown as mean ± 95 % CI; * represents significant difference (p < 0.05) between ACLT and contralateral knee within each treatment group. n = 9–10 joints in each group.
