
Fig. 9.
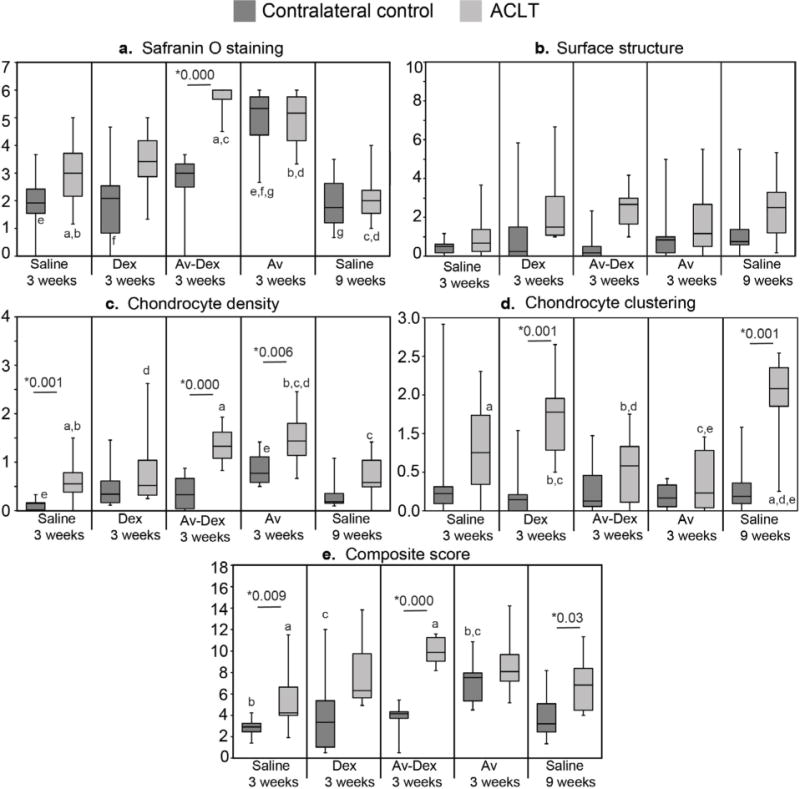
Histological scoring of cartilage degeneration. Categorical scores as well as the composite histological score are presented as box-and-whisker plots (n = 8–10 condyles/group). Median values with 25th–75th quartile range are reported. * shows significant difference between ACLT and control within each treatment group using Mann Whitney U test. Groups that share letters within each graph are significantly different from one another (p < 0.05, Kruskal-Wallis ANOVA followed by post hoc Dunn’s test).