
Figure 3.
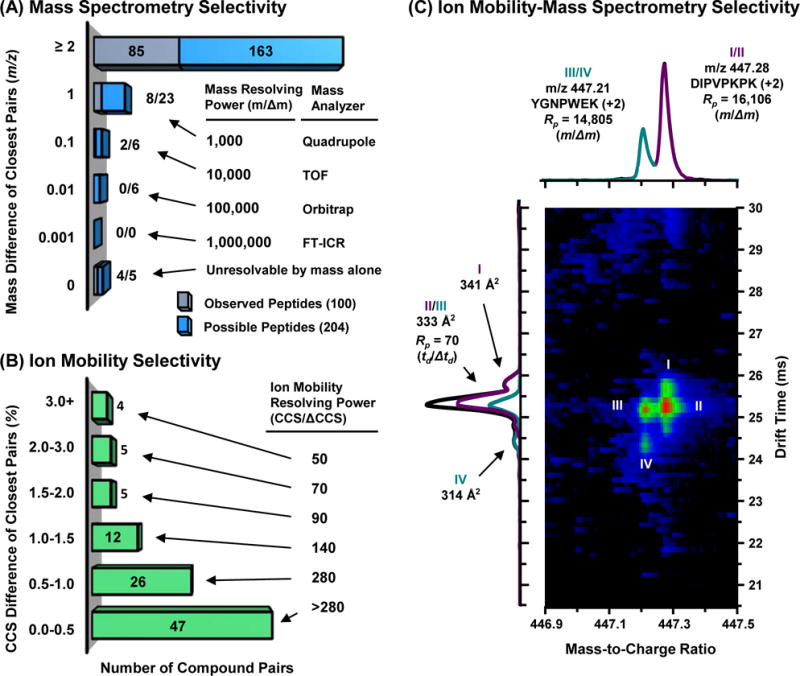
Comparison of mass spectrometry and ion mobility data collected from a tryptic peptide mixture originating from four proteins. (A) Difference in m/z between nearest neighbors for all possible peptides in the digest mixture (light blue) and from those peptides observed experimentally in this study (gray). (B) Bar graph of the percent difference in CCS between nearest-neighboring peptides for the 99 analyte pairs observed. (C) Separation of two doubly charged peptides by mass spectrometry and suspected conformers of each peptide noted through ion mobility.