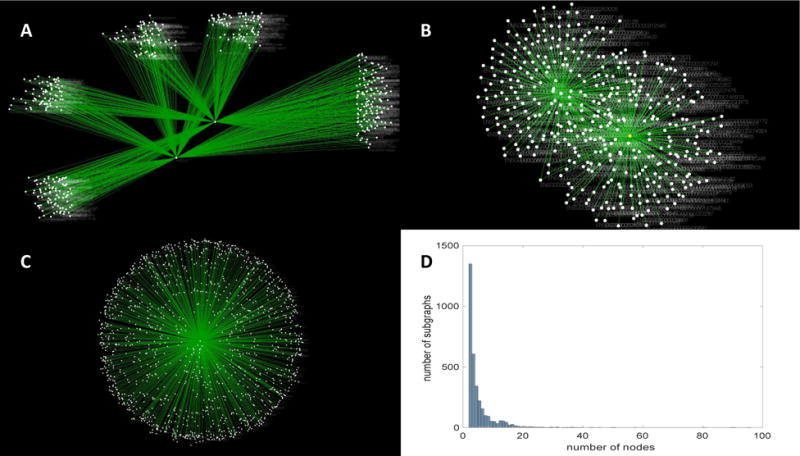
Figure 2.

Subgraphs separated from gene homolog network. A: Gene family 6, B: Gene family 18, C: Gene family 32, D: Histogram of gene family sizes. Outliers were removed past 100 nodes so that the distribution of the common (smaller) sizes could be seen.
