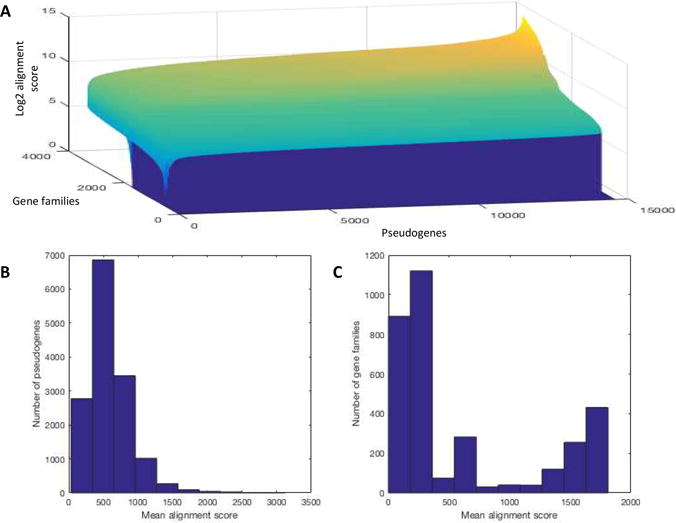
Figure 3.

A) The distribution of pairwise pseudogene to consensus gene alignment scores for all pseudogenes and consensus genes (color also signifies Log2 alignment scores, lighter is higher and darker is lower). B) Distribution of mean pseudogene alignment score. C) Distribution of mean gene family alignment score.
