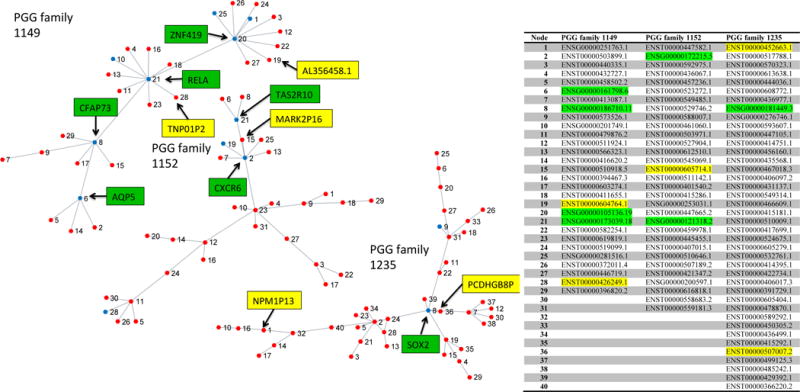
Figure 4.

Minimum spanning trees of PGG families 1149, 1152 and 1235 with pseudogenes (red nodes) and genes (blue nodes). Genes of interest (with GO annotation or bottleneck node) are highlighted in green and pseudogenes of interest (with possible functional relationship to gene family) are highlighted in yellow.
