
Figure. Kaplan-Meier Overall Survival Plots by CD8+ Tumor-Infiltrating Lymphocyte (TIL) Levels for the High-Grade Serous, Endometrioid, and Mucinous Ovarian Cancer.
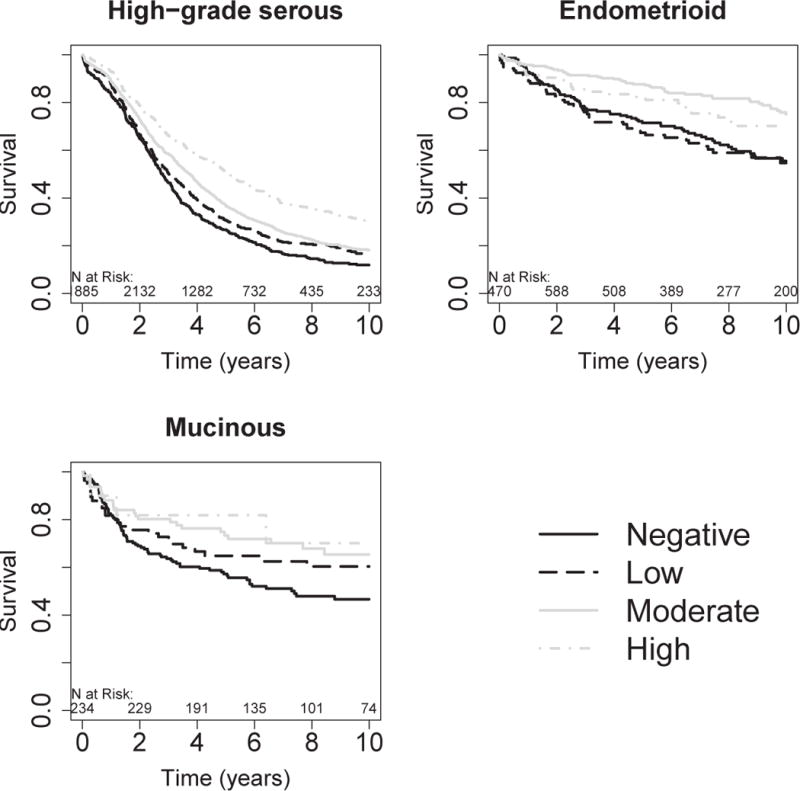
Negative, no CD8+ TILs; low, 1–2 CD8+ TILs; moderate, 3–19 CD8+ TILs; high, 20 or more CD8+ TILs per high-powered field. The numbers just above the x-axis represent the number of women at risk in two year time intervals. Number at risk on date of diagnosis may be smaller than number at risk later due to left truncation of follow-up resulting from delayed study enrollment.