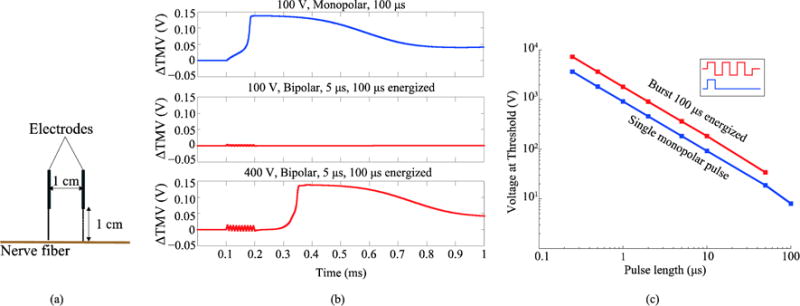
Figure 4.

(a) Modeled geometry (b) Time evolution of the TMV increase with respect to the resting voltage when different pulses are delivered. Top, a 100 V monopolar pulse (starting at time = 0.1 ms) triggers an action potential. Middle, a burst of bipolar pulses with the same amplitude and energized time does not cause any response. Bottom, the same burst with a higher amplitude (400 V) triggers an action potential. (c) Minimum voltage amplitude across the electrodes able to trigger stimulation as a function of pulse length when a single monopolar pulse is applied and when a full burst of bipolar pulses with a 100 μs of total energized time is applied.
